Having Fun With vscode#
Recently I have started phasing out my long love vim and use vscode much more.
While doing so, I’ve discovered some more involved tricks, and I was recently asked if I can do a primer for vim users.
Getting Started#
I generally use the visual-studio-code-bin package on arch, or the official microsoft branded variant on ubuntu. Though none of this is specific to the microsoft release. At worst you have to find the exensions yourself.
First Look#
When we first look at vscode, it greets us with a somewhat bare welcome view.
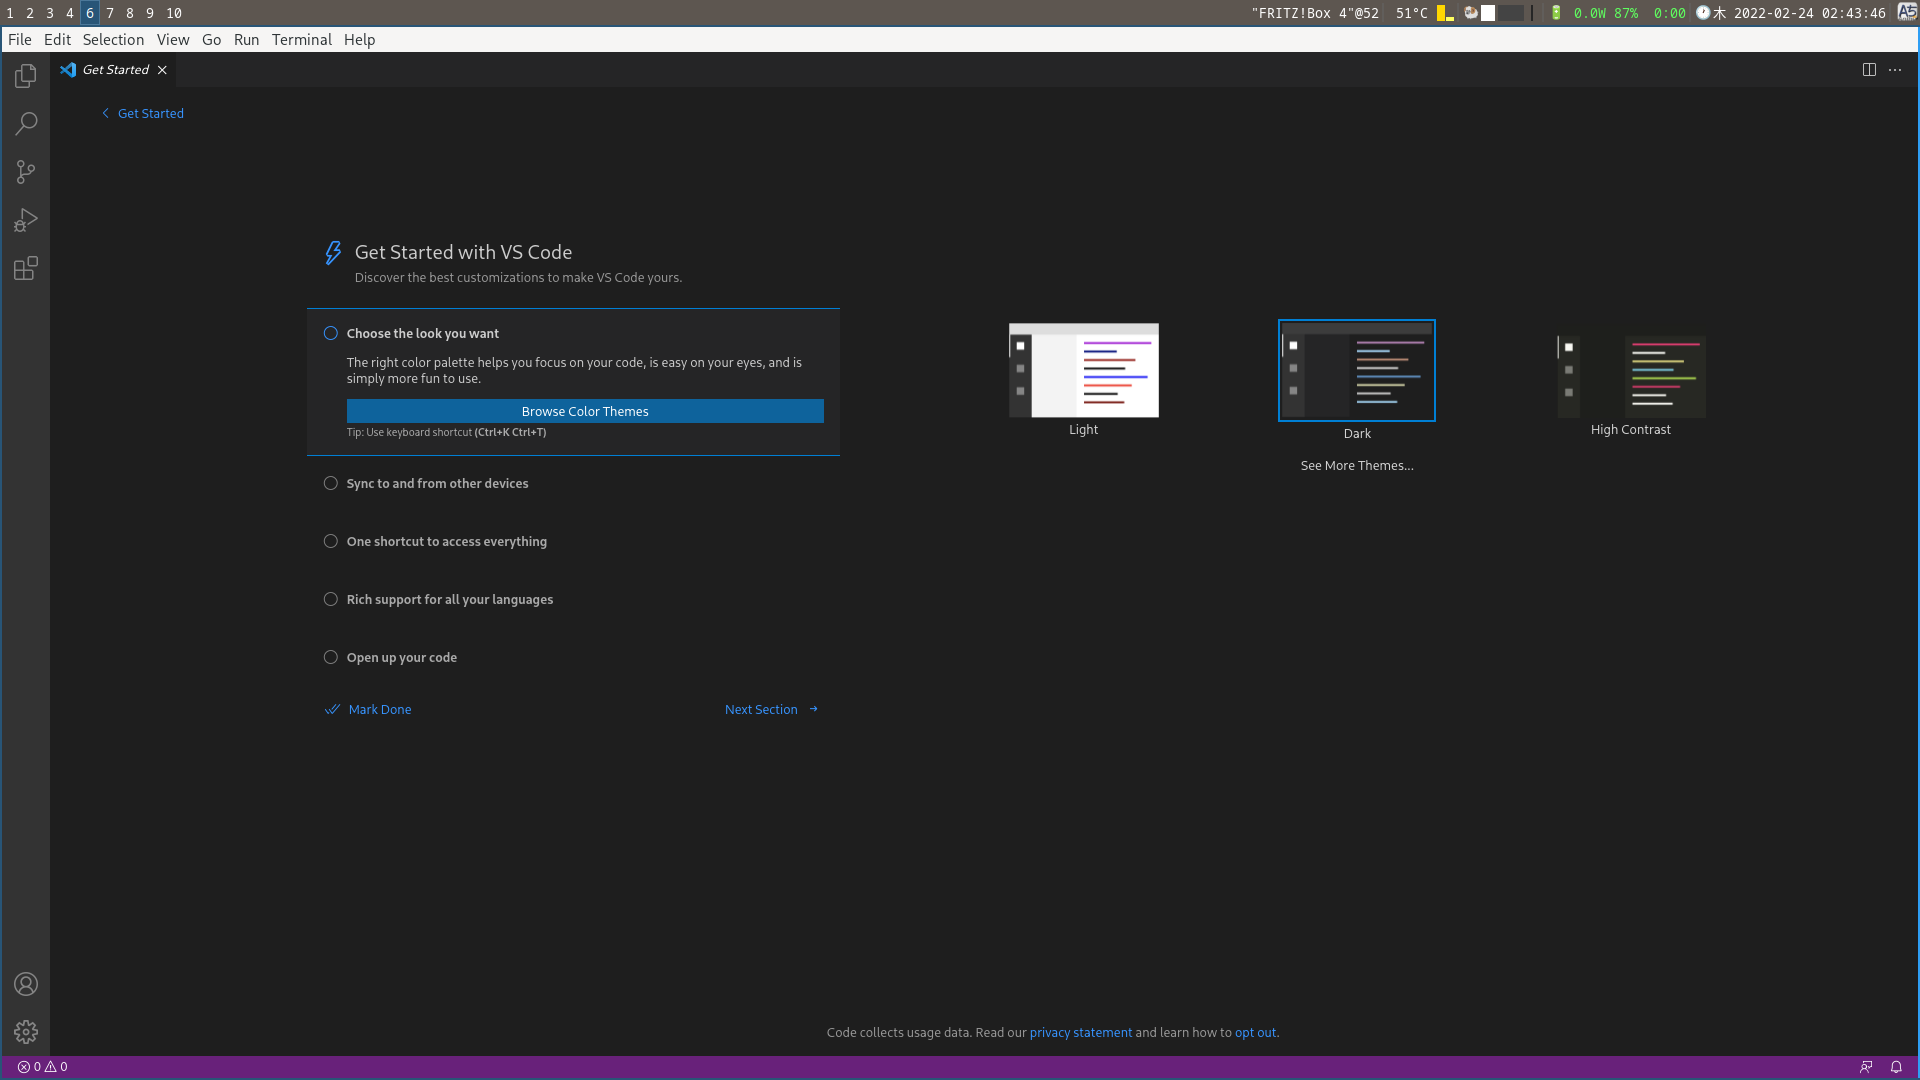
While we could use the editor like any old editor and just open files, I think the most relevant mode of operation comes with “Open Folder”.
In vim terms, I think of this like moving my cwd around. It makes all the nice features consider your directory.
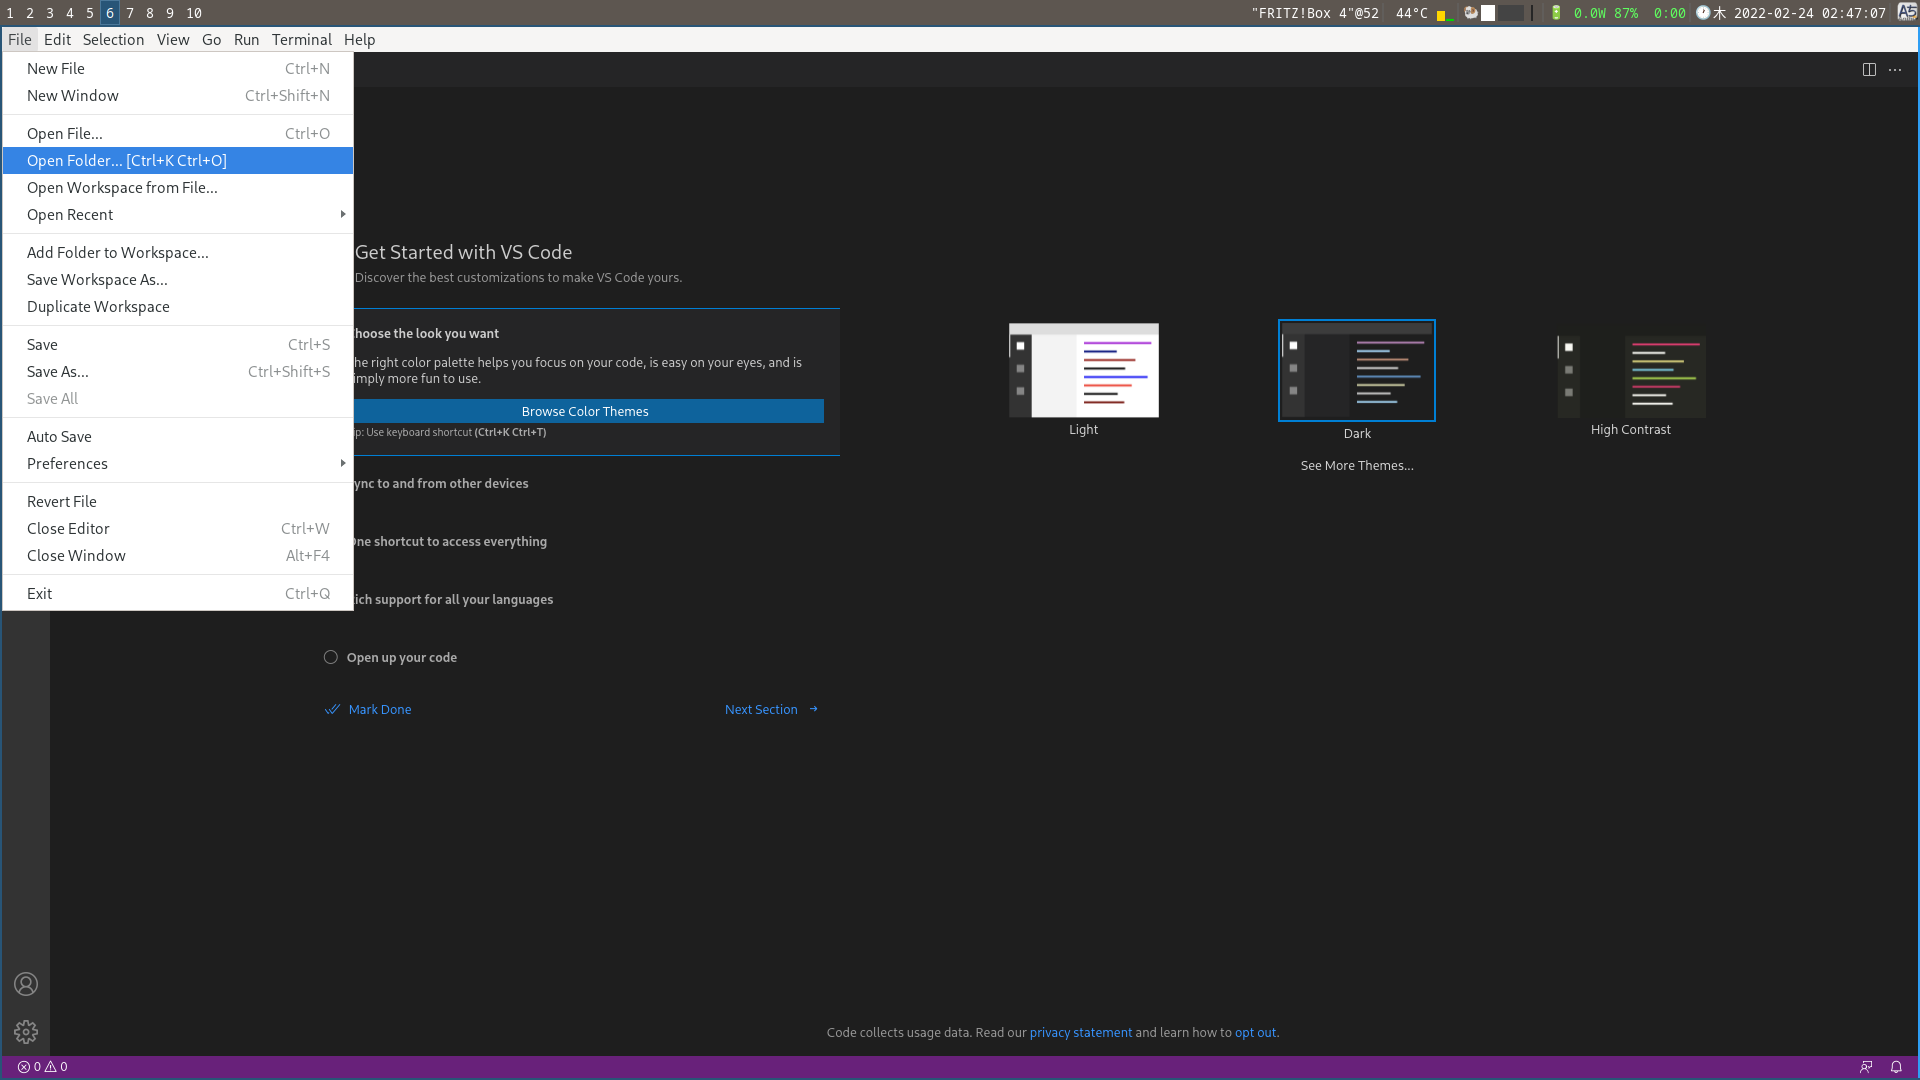
After opening the directory, the sidebar to the left gets filled with the current directory context.
It’s All About Extensions#
When you first open a file of C or C++ code, you’ll be kindly hinted that there are extension that help handling this kind of code. You can either just install the entire C/C++ Expansion Pack or pick your own.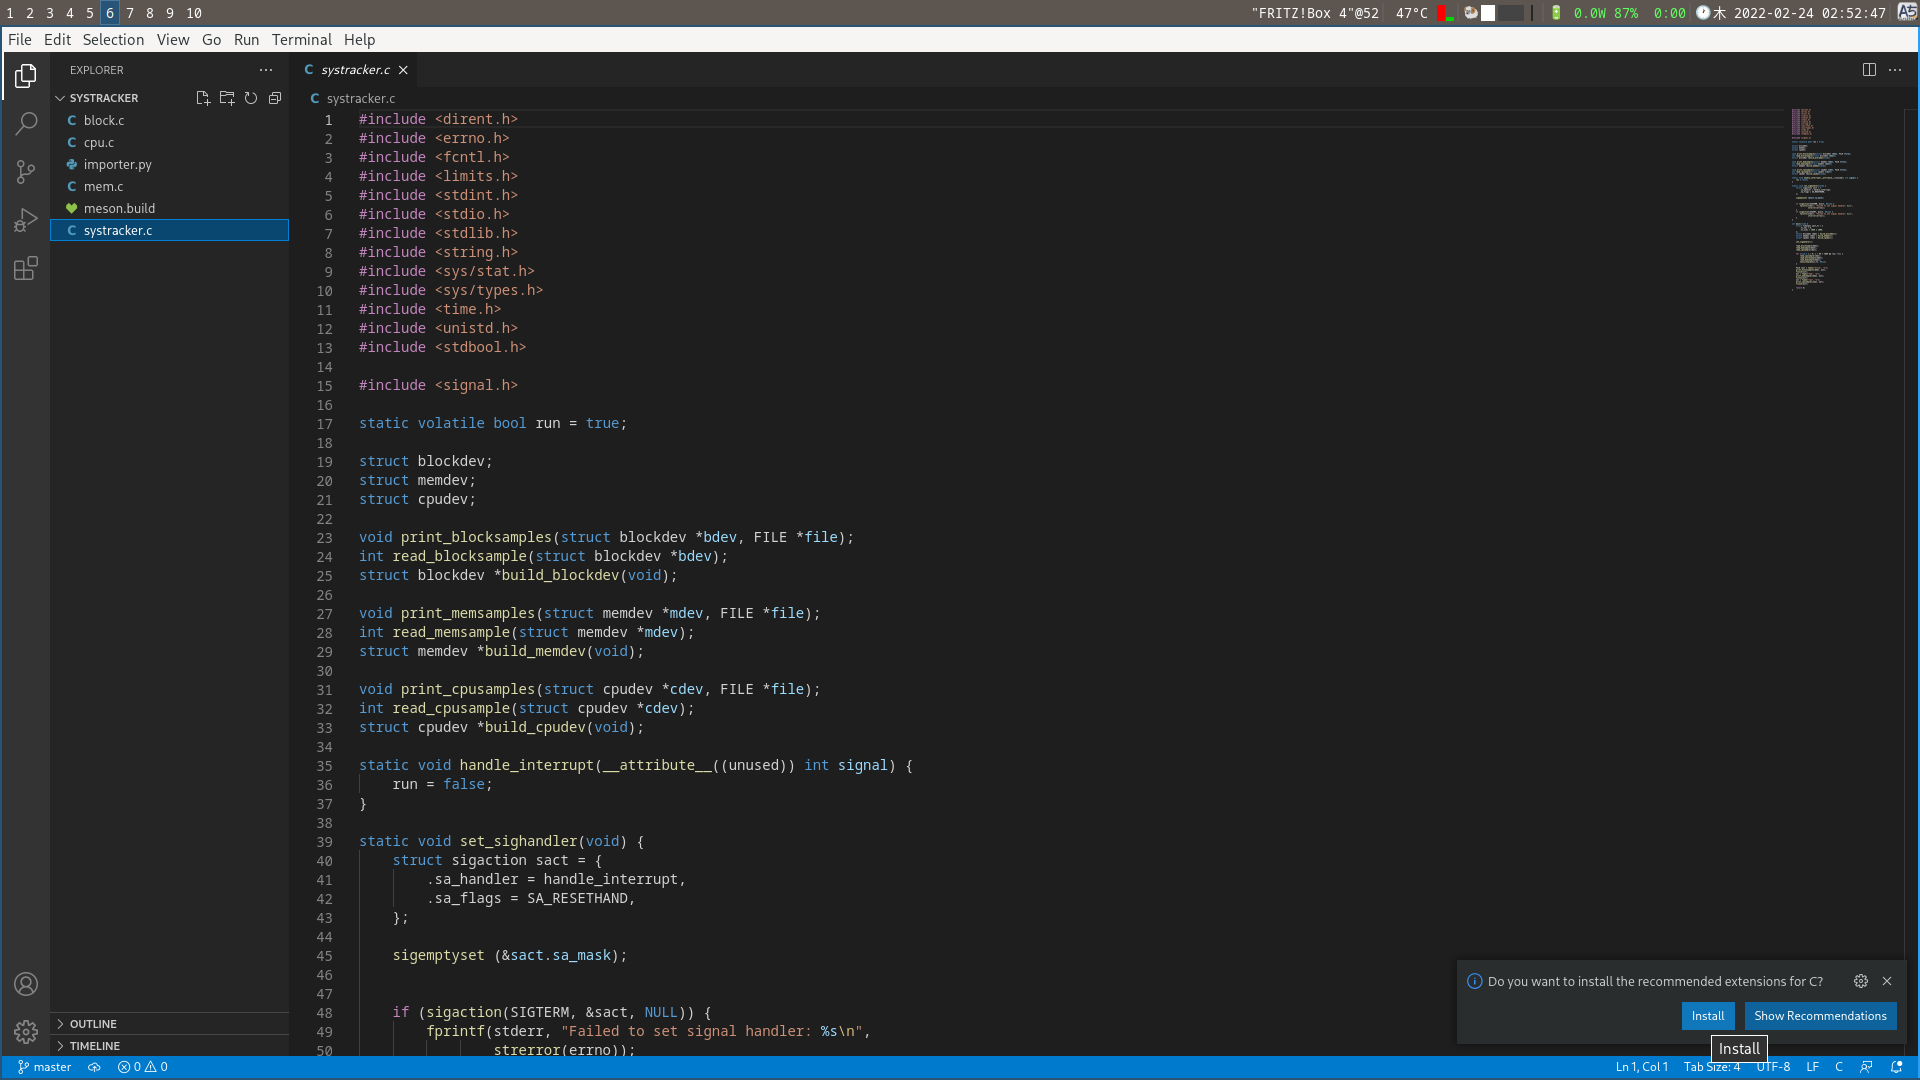
To keep the screenshots clean, I’ve selected only the extensions we need at the moment.
Outside the suggested expansion pack, I’ve also installed the meson extension, since that’s what I use.
And of course, a vim mode extension, so I can use the text editor as I am used to.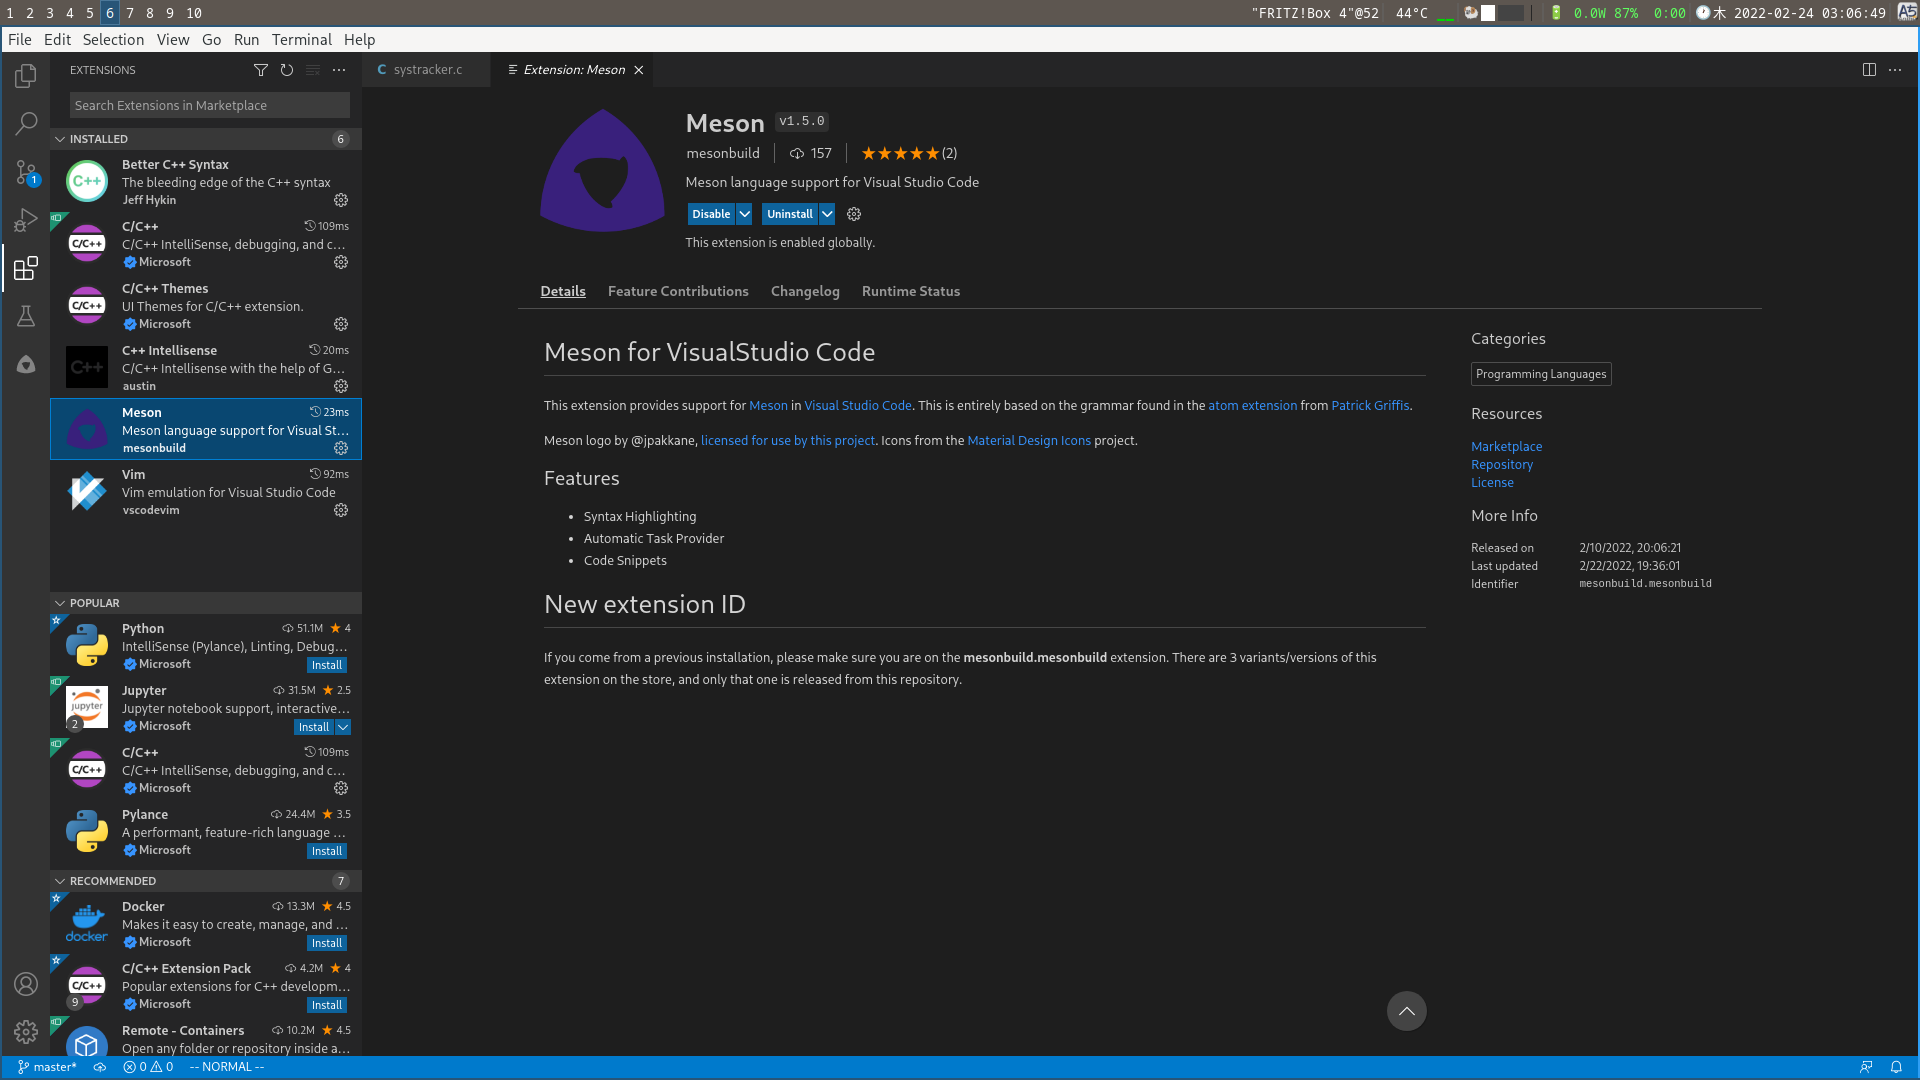
The meson extensions prompts for whether you want to configure your project. Press yes/this once here. If you miss this, you can run the configuration later, but it helps to get it done automatically.
First Build#
Equipped with all this power at our hands, we obviously don’t just want to edit some text files, but also interact with our code in a more structured way.
Code doesn’t do much. Binaries do. So we first want to get a build started.
Luckily, the meson extension makes that easy for us. There is a general keybing in vscode for running build tasks: [ctrl] + [alt] + b.
When you press it, a selction comes up. Pick the option to build all targets (or specific ones if you prefer).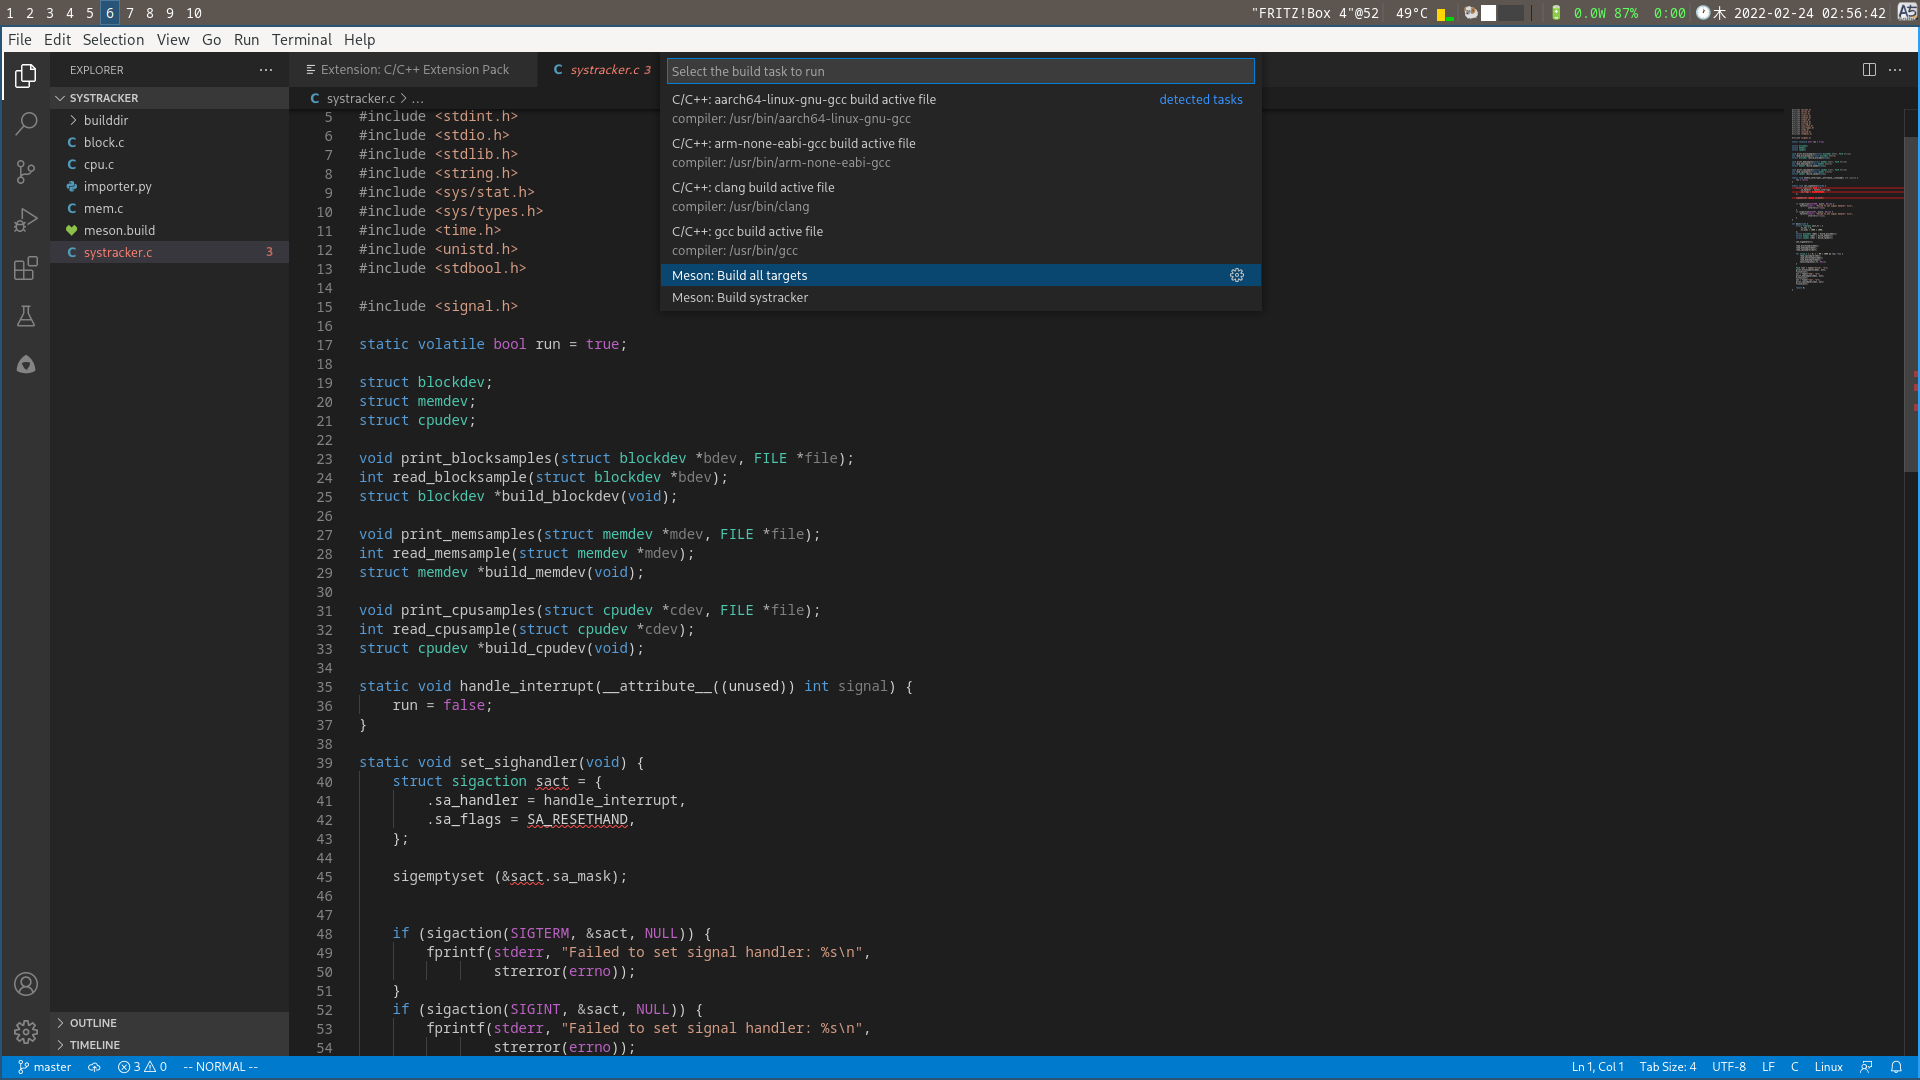
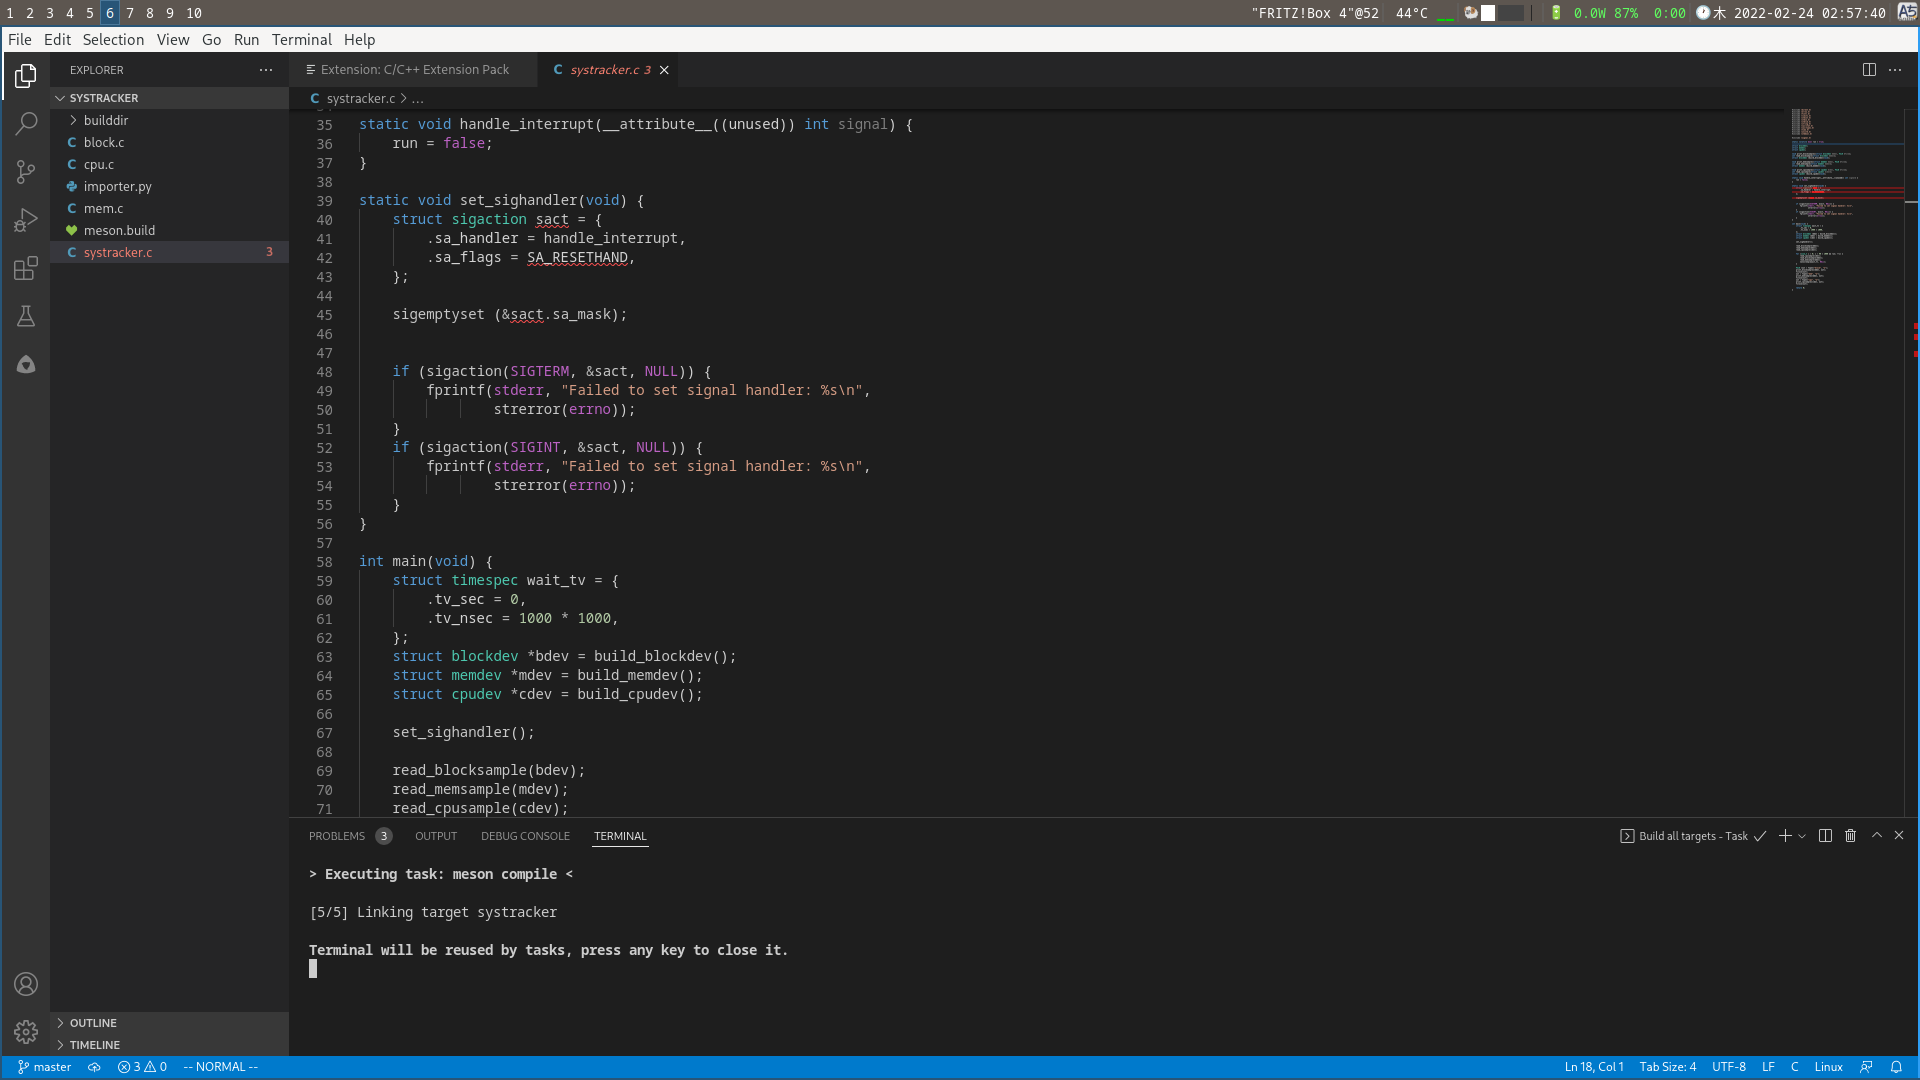
In the bottom, a terminal pops up with the output of our build process. In my case, it builds 5 targets without any issues.
When we build the project, we are asked whether we want to use the generated compile.json file to configure intellisense. This allows the integrated code explorer and compile error generation to pick up on our dependencies and compile flags. So of course we want to. With this new found power, the editor will be able to figure out my declarations are correct. So I don’t get swiggly lines under working code anymore.
With this, we have the basics we want from any editor to work with code. Whiel the outline and other features are nice to haves, we can get used to them in time. The first step I recommend everyone does though: Right click on a symbol, take a look at the “Goto/Peek” versions for references and definitions. Thanks intellisense.
Debugging#
While better editing is nice, I have never really warmed up to cli/tui gdb. And vscode provides a decently IDE debugger experience.
If you are using the meson extension, there will be auto generated debug configurations for all executable targets.
To find them, open the debugging view on the right, and then click on the “Show All Automatic Debug Configurations” button.
This will pop up another selection. In there, go for the C++ GDB Option. You should see an option for all executables.
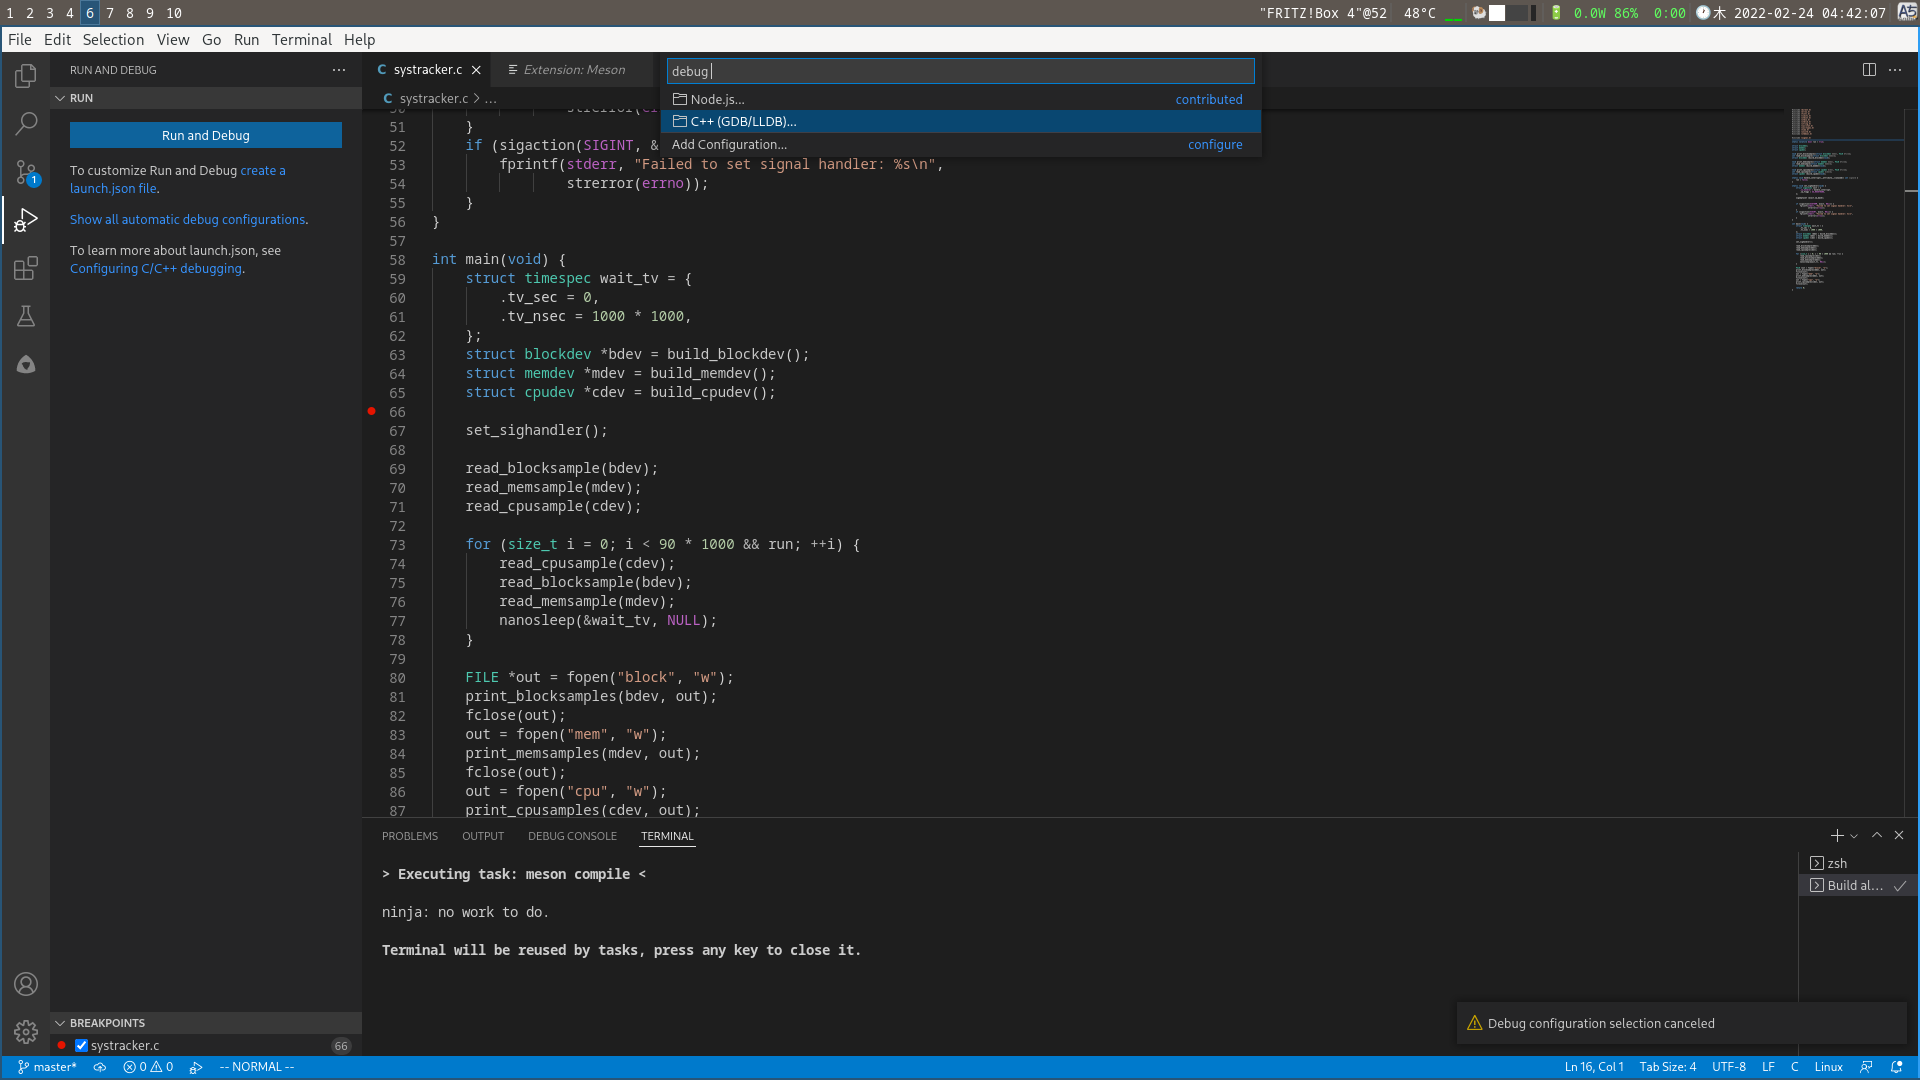
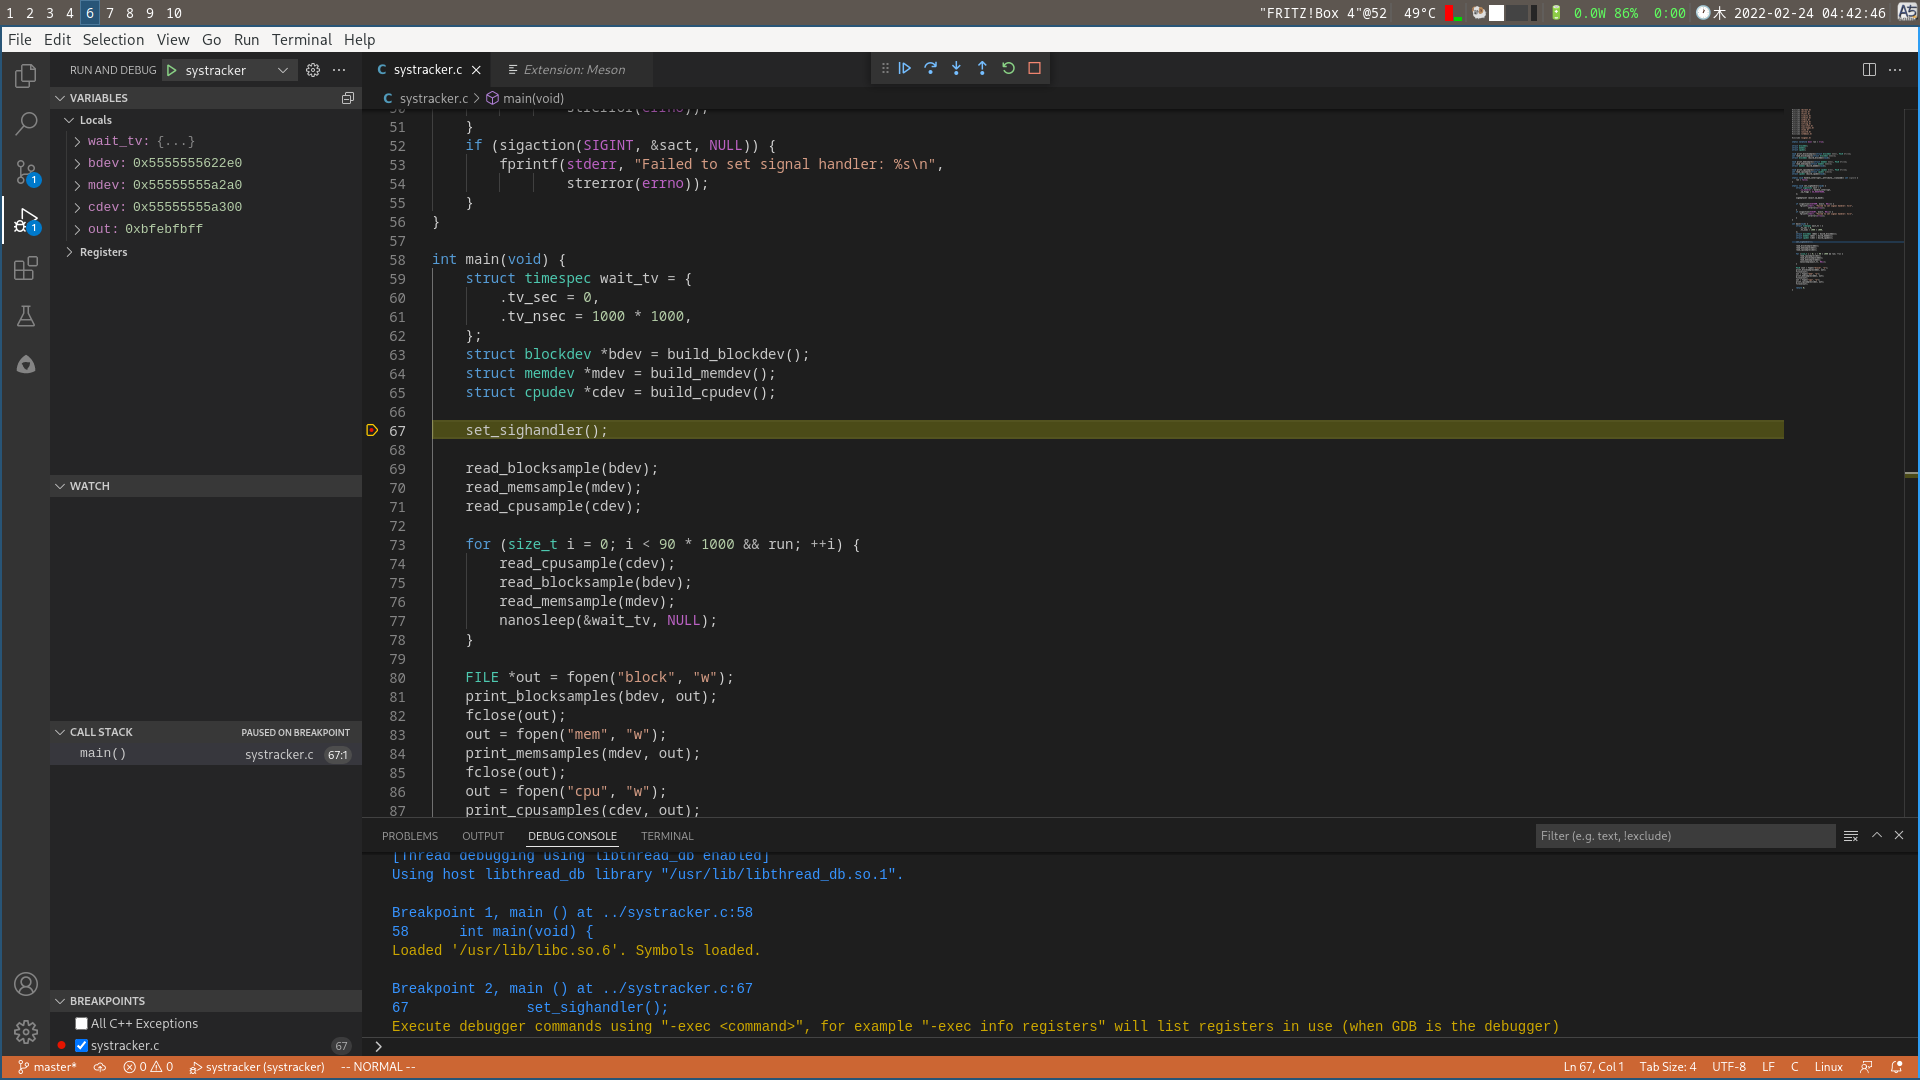
In my example, I have set a breakpoint (the small red dot left of the line numbers). You can create/remove them by clicking where the dot is.
With this breakpoint, execution is stopped, and we get the debugger view of the current execution.
The most useful parts to me are the local variable explorer (top left) and of course the stepping buttons in the top.
You can obviously also keep track of your call stack, or even arbitrary expressions. But I think there are debugging guides out there.